|
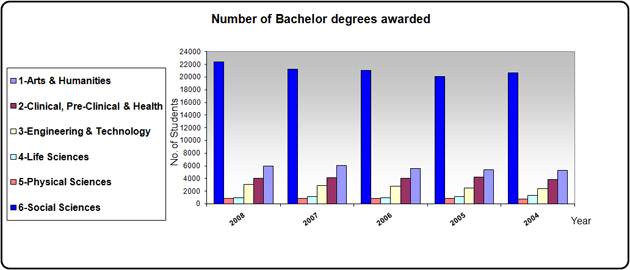
Number of Bachelor degrees awarded |
||||||
|
Year |
Social Sciences |
Arts & Humanities |
Clinical, Pre-Clinical & Health |
Engineering & Technology |
Life Sciences |
Physical Sciences |
|
2004 |
20672 |
5298 |
3831 |
2369 |
1360 |
728 |
|
2005 |
20062 |
5358 |
4183 |
2474 |
1146 |
822 |
|
2006 |
21089 |
5539 |
4057 |
2829 |
955 |
826 |
|
2007 |
21262 |
6049 |
4095 |
2856 |
1149 |
825 |
|
2008 |
22422 |
5955 |
4005 |
3088 |
1007 |
854 |
Back