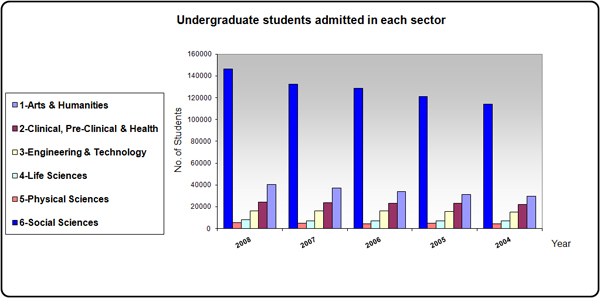
|
Undergraduate students admitted – Total |
||||||
|
year |
Social Sciences |
|
Clinical, Pre-Clinical & Health |
Engineering & Technology |
Life Sciences |
Physical Sciences |
|
2004 |
114053 |
29524 |
21944 |
14941 |
7119 |
4433 |
|
2005 |
121221 |
31013 |
23259 |
15927 |
7231 |
4636 |
|
2006 |
128842 |
34035 |
23326 |
16190 |
6972 |
4473 |
|
2007 |
132552 |
37205 |
23920 |
16417 |
7259 |
4823 |
|
2008 |
146500 |
40413 |
24021 |
16367 |
7955 |
5173 |
|
Of which are international/overseas origin FTE |
||||||
|
year |
Social Sciences |
Arts & Humanities |
Clinical, Pre-Clinical & Health |
Engineering & Technology |
Life Sciences |
Physical Sciences |
|
2004 |
1097 |
218 |
699 |
280 |
114 |
62 |
|
2005 |
1066 |
232 |
544 |
205 |
88 |
41 |
|
2006 |
1298 |
228 |
588 |
307 |
89 |
47 |
|
2007 |
1443 |
253 |
814 |
338 |
104 |
74 |
|
2008 |
1309 |
273 |
1143 |
384 |
176 |
104 |
|
Of which are women |
||||||
|
year |
Social Sciences |
Arts & Humanities |
Clinical, Pre-Clinical & Health |
Engineering & Technology |
Life Sciences |
Physical Sciences |
|
2004 |
48906 |
20105 |
11694 |
3927 |
3351 |
2551 |
|
2005 |
53421 |
21385 |
12886 |
4090 |
3465 |
2588 |
|
2006 |
57188 |
23732 |
13124 |
4367 |
3273 |
2527 |
|
2007 |
57612 |
25626 |
13336 |
4422 |
3419 |
2642 |
|
2008 |
63109 |
27763 |
13245 |
4597 |
3228 |
2891 |
Back